Applied economics
5 ECTS
What can you learn more about on this website?
Introduction to accounting understanding and calculation of operation-related key figures.
Video clip introducing the economic concepts.
Video clips introducing the use of Excel.
Examples of financial sub-analyses you can carry out based on your own reality.
Find more about Excel at the link below:
Use the code: Egill
Theoretical calculation model
"Among other things, you can use the following sub-analyses to make better financial decisions, including optimizing your pricing."
Sub-analyses are often crucial for the restaurant business to gain insight into what is earned on the individual service. Sub-analyses or calculations are also used to determine menu prices and menu content, for planning events, for package offers, etc.
On this page you can find examples of case descriptions that show how you can work with sub-analyses. Look through them and choose the one or those that best suit your case and business unit.
Sub-analyses often start with you segmenting your customers. Which customer segments do you address in your business unit? And what proportion constitutes which segment of total revenue?
The method we work by
The reason we want to work with finance and analysis of our company is to create long-term value. We therefore develop the company so that the products we sell are up-to-date and financially sustainable, so that we can make ongoing new investments and maintain the existing ones.
Our analysis work is based on typical historical data, both financial, guest segments and, for example, guest loyalty. In addition, we can be inspired by knowledge from outside, which we connect to our own reality.
We apply the theoretical approach to accounting analysis by dividing our costs into variable costs (the costs we follow with a given unit sale) and our fixed capacity costs (the costs we have committed independently of the individual unit sale, but which nevertheless most often have a correlation with our level of activity).
Accounting analysis
The enterprise collects daily financial data such as sales, prices, purchases of raw materials, labor costs, rent, etc. This data is recorded in a so-called chart of accounts, which, when the current values are extracted, is called a balance sheet. The balance sheet therefore contains the most detailed financial data of a period and when these data are organized, a profit and loss account is formed.
The financial figures you see as a manager or middle manager are therefore processed data presented in a financial report.
When you analyze the financial reporting, for example for 1 month or 1 full financial year, it is called an 'earnings analysis'.
The theoretical Profitability Analysis contains a number of key figures that you can learn more about on this page. If you want to know even more about financial management in the hospitality sector, you can read the book:
Financial management in practice - 4th edition
Published by: Forlaget Praxis
Author: Annette Vangstrup
The earnings analysis - summary
Costs can be divided into two:
Variable costs that follow sales. When selling a product, a cost is included. For example, the sale of a beer represents the variable cost of the purchase price of that beer (consumption of goods per beer). The total variable cost per unit sale is called 'variable unit cost'.
Capacity costs that are independent of individual sales. These costs are, for example, salaries, rent, administration, marketing, etc.
When consumption of goods is deducted from turnover alone, the gross profit is obtained, which as a percentage of turnover is called the 'gross profit percentage'.
Subtracting additional 'other variable costs', the 'contribution margin' appears, which as a percentage of turnover is called the 'contribution margin'.
Break-even turnover is the revenue that exactly must be achieved before profit before interest is zero.
Break-even revenue can be used for many things, such as:
What needs to be traded for per opening day?
How many tickets should be sold for a given event?
What happens to my break-even revenue when I increase my capacity cost, for example, by a marketing cost?
The safety margin is the 'air' in percentage between realized revenue and break-even turnover. The higher the safety margin, the more revenue can fall before the company makes a loss.
Operating margin is the key figure in an earnings analysis. It shows what 'profit before interest' represents as a percentage of turnover.
The development in the 'profit margin' is explained by comparing with e.g. several years and looking at how the gross profit percentage, the coverage ratio, the wage ratio, the zero point turnover, and the safety margin have developed.
We have collected the most important key figures in a booklet, which you can download on this page.
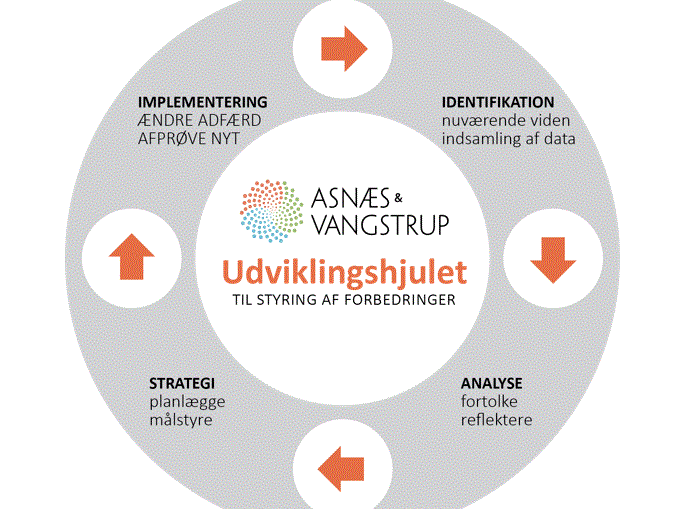
The development circle - what will the data be used for?
The development circle is structured around four key elements:
Identification – in this phase we collect current knowledge.
Analysis – in this phase, we examine what data "tells" us.
Strategy – now we plan.
Implementation – and here we execute the plan.
It is essential that we consider this process continuous – the circle never ends.
Each improvement forms the foundation for the next improvement, thus becoming ours
businessmore and more well run.
Task - entrepreneur café
Read the task and solve both text and the arithmetic part. On page 2 of the spreadsheet is a proposal for a solution. Maybe you can apply the development circle in your solution? Wait to see the proposed solution until you have worked out a solution yourself!
Examples of sub-analyses
Once you have understood the financial key figures and concepts, you can become even better at working with them in practice by training in the preparation of 'sub-analyses'. We have described this method above and as the basis for the course 'Applied Economics'. We recommend that you choose a relevant analysis topic, e.g. based on one or more of our examples, and which you find to be very relevant to your everyday life.
When preparing one of these or self-selected partial analysis, remember that you distinguish between the variable costs (calculated per unit sold) and the proportion of capacity costs related to this activity.
Here we have gathered a small pile of sub-analyses and an inspirational case about Coca-Cola pricing that may be good to start with:
Luxury coffee
Too good to go
Cake sale
Dish of the day
Bring the steak home
Coca-Cola pricing
Analysis of deals, etc.
When the company cannot sell the entire capacity itself, a choice must be made between different sales channels. The marketing collaboration is the natural first place to get help with sales. Here, the cost is, for example, a fixed annual fee supplemented by, for example, 10 per cent of what is sold.
The most expensive sales channels are, for example, the online spot deals websites, Just-eat or Wolt, where we can carry out a partial analysis of our earnings when choosing a sales channel where we pay a commission or are settled at a lower net price:
What price can the sales channel sell at?
What is the commission – i.e. the cost of sales, so we know the net price
What guest loyalty (NPS score) do we typically achieve from this sales channel?
Events
We know that the more aware you are of the consequences of the choices you make, the better you are at making money from the service you provide.
When we look at financial reporting, we may find that revenue may increase regardless of which choice we choose. Where it gets interesting is to see if sales convert to the bottom line.
The case and Excel file show a strategic analysis that uncovers USP and positioning in the market in relation to events. In addition, additional sales potential is looked at in activities in connection with an event.
Minimum price
All companies must know their minimum price for their services, e.g., rooms, restaurant services, and not least packages that include, for example, both room, dinners, breakfast and perhaps an activity.
In this case you can read an example of calculating the minimum price on a package consisting of 2 persons hotel accommodation with 2 times dinner, coffee, and breakfast. This is also seen in the excel file.
Analysis conference packages
If, as a conference hotel, you have fixed prices all year round combined with many permanent employees, it can lead to fluctuating revenue/earnings over the year while the fixed costs remain the same. By making use of dynamic pricing on local ownership, the large fluctuations in the percentage and earnings can be 'offset' over the year.
The case and excel file show the calculation of the minimum price of a conference package, as well as the calculation of the additional earnings on a conference package by increasing the price by DKK 100 per conference day.
Menu planning
Or in English 'menu engineering' is a term that contributes to analyzing the restaurant's menu sales combined with earnings per product.
Whether or not you have very detailed data available about which dishes you sell how often, you might want to start by making an educated guess.
Here you can read an article on the topic with an associated analysis model for dividing your dishes.
In addition, try searching the web for more information, there are many relevant videos on the subject.
Management Sheet
Analysis of last week's activity - for planning the coming weeks.
Here you can download a management sheet and insert your own data from last week. It may seem like a big task and/but the benefits of looking at realized data that are so new mean that you gain unique knowledge of the realized correlation between revenue and resource consumption. Please note that it is the purchase of goods on food we register and thus not the consumption of goods. In the case of particularly large purchases of goods for stock, e.g., of expensive meat, fish or the like, it will have an impact on the week's estimated kitchen percentage. When inventory every week, however, it will even out. In relation to beverages, the control sheet only uses the inventory decline, which means that you record your beverage sales and the calculated item consumption as a percentage. The reason for this method is that we typically buy drinks at greater intervals than food, and that the drinks can be stored without waste.
Booklets - ready to print
Tool booklet 1 contains a lot of good explanations of key concepts.
So does tool booklet 2 - the last pages of tool booklet 2. can be printed out and used as training sheets
Videos
SWOT and TOWS are great models for business development, watch the video below on SWOT and TOWS
Finally - the exam
When you have passed this course, you have earned 5 ECTS points that you can use for a total Academy education, which requires a total of 50 ECTS credits and a Final Project.
The exam form is oral and lasts approx. 20 min. After the 20 min. the censor and I agree on your character, and we call you into the room (or virtual room) again.
Our cooperating Business Academy officially sends exam papers and Asnæs &Vangstrup sends a diploma that tells in headlines about the content you have been through.
This page presents the synopsis (assignment) that must be submitted on Wiseflow before the exam day.
For the exam, it is important that you apply the correct financial concepts and challenge yourself to come up with as many perspectives and contexts as possible.
In conclusion:
Do you conclude on your problem statement?
Provides concrete summary of what you want to do in the future.
Reflect on what your outcome of the course has been.
Good luck, and remember the exam is a day of celebration.


